
Understanding the Generate Fine-tuning Results
In this section, we will explain the metrics for a fine-tuned model for Generate.
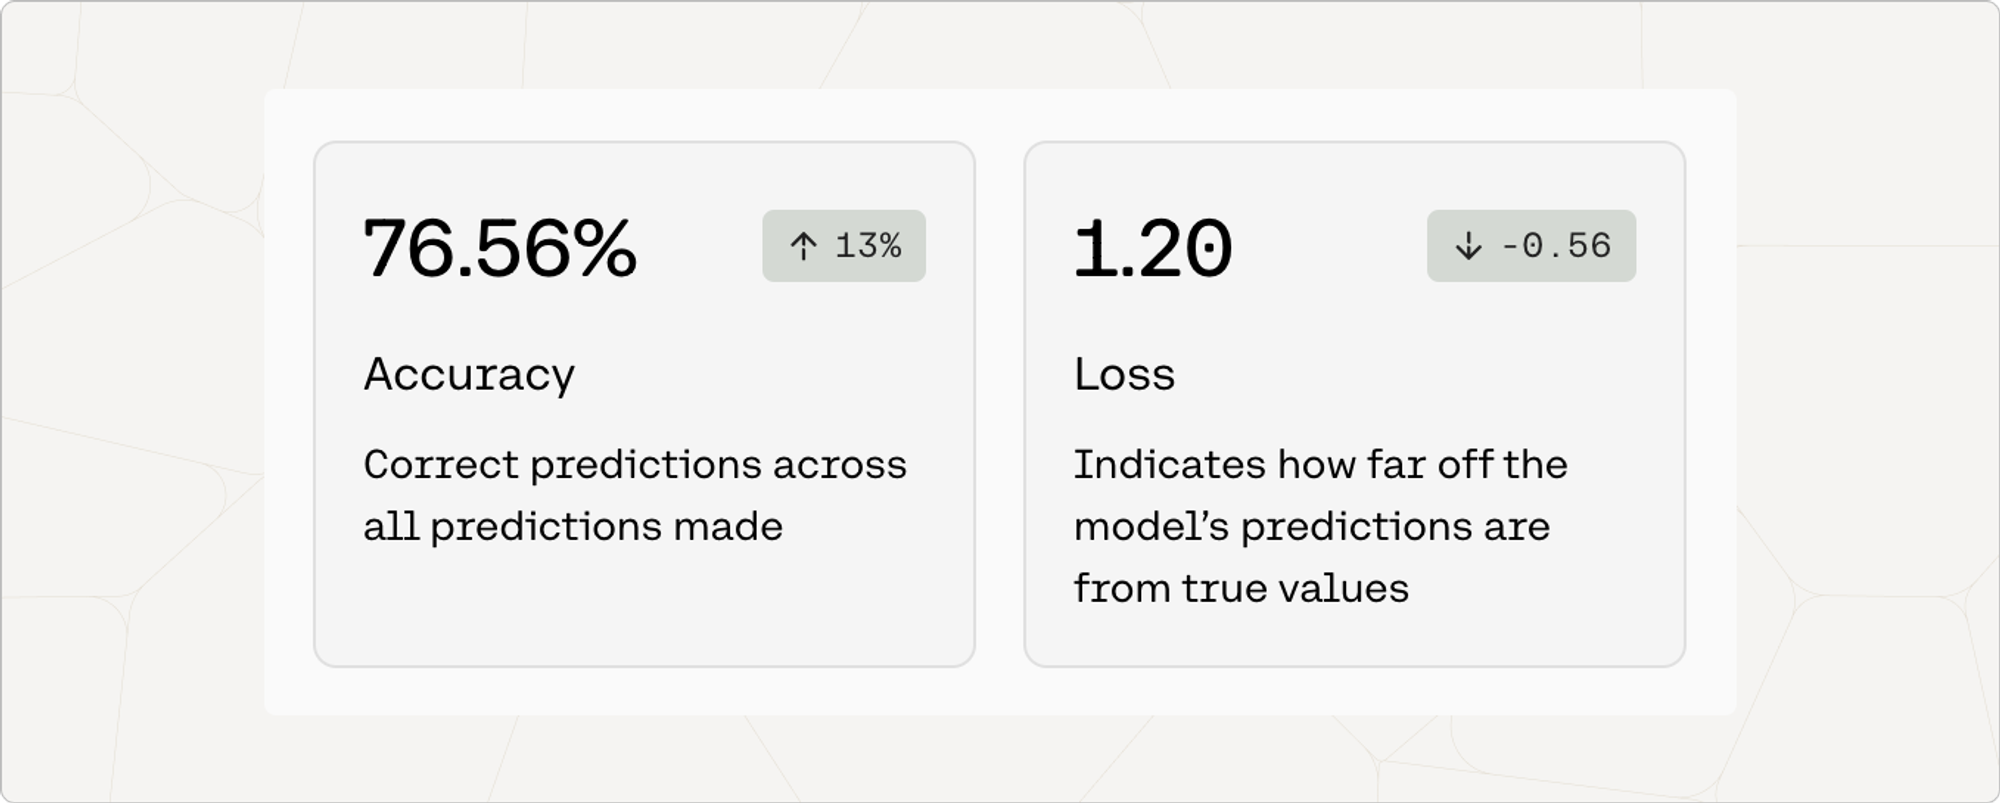
When you create a fine-tuned model for Generate, you will see metrics that look like this:
The next few sections explain what these and other metrics mean, but we always suggest that you play around with the model in the playground. Note, however, that while these metrics are a good place to start, you'll still have to assess whether the model's performance feels right because the outputs of a fine-tuned model are often best evaluated qualitatively.
Accuracy
Accuracy is a measure of how many predictions the model made correctly out of all the predictions in an evaluation. To evaluate generative models for accuracy, we ask it to predict certain words in the user-uploaded data.
The number in the pill (eg. 13%) is the difference between the accuracy of the default model when the user started training, and the accuracy of the model that is deployed. This difference is a proxy for how much accuracy improved when the model was trained on the dataset.
Loss
Loss is a measure that describes how bad or wrong a prediction is. Accuracy may tell you how many predictions the model got wrong, but it will not describe how incorrect the wrong predictions are. If every prediction is perfect, the loss will be 0.
To evaluate generative models for loss, we ask the model to predict certain words in the user-provided data and evaluate how wrong the incorrect predictions are. A loss around 11 indicates totally random performance.
For this reason, the loss should decrease as the model improves. The number in the pill (e.g. -0.56) is the difference between the loss when the default model started training and when it was deployed. This difference is a proxy for how much loss improved when the model was trained on your dataset.
Token likelihood is a useful tool for model evaluation. For instance, let's say you've created a fine-tuned generative model and would like to know how much it's improved over the default model. You could do this by using token likelihoods to compare the performance of the models on some held-out text. In the next section, we'll go through a quick demonstration of how to use the return_likelihoods parameter from the Generate endpoint for model evaluation.
Assessing a Fine-tuned Model's Performance with Likelihoods
Let's say we've trained a base-light custom model on Shakespeare data. We'd like to confirm that this fine-tuned model has a higher likelihood on Shakespeare text than the default model does. To do this, we could hold out the following snippet from the training data:
"To be, or not to be: that is the question:"
"Whether ’tis nobler in the mind to suffer"
"The slings and arrows of outrageous fortune,"
"Or to take arms against a sea of troubles,"
"And by opposing end them. To die: to sleep..."
Then we could use the following example code to retrieve the average log-likelihood of the above snippet:
curl --location --request POST '<https://api.cohere.ai/generate'>
  --header 'Authorization: BEARER {api_key}'
  --header 'Content-Type: application/json'
  --data-raw '{
      "model": "base-light",
      "prompt": "To be, or not to be: that is the question: Whether ’tis nobler in the mind to suffer The slings and arrows of outrageous fortune, Or to take arms against a sea of troubles, And by opposing end them. To die: to sleep...",
      "max_tokens": 1,
      "temperature": 1,
      "k": 0,
      "p": 0.75,
      "return_likelihoods": "ALL"
    }'
In the table below you'll find the average log-likelihoods of the snippet, for both the baseline and custom base-light models:
| MODEL | AVERAGE LOG-LIKELIHOOD |
|---|---|
| base-light | -2.99 |
| custom-base-light | -1.12 |
This demonstrates that customizing this model increased the likelihood of Shakespeare data!
Updated about 1 month ago